Related Rates: Compost oh compost

I'm on a nitrogen kick, I guess. While researching the previous post on beets, which ought to have a follow-up when we get to integration (did you do the worksheet?!), I learned a bit about carbon-nitrogen ratios in compost. The ratio of carbon to nitrogen is important because compost gets hottest when this ratio is around 30:1. Empirical evidence supporting this is not too hard to find, but a mathematical model is hard to find! This is why you need to mix "browns" and "greens" in your home compost.

Again, nitrogen is a very important nutrient for vegetable and grain growth -- if you use up the nitrogen from your soil you'll have small flowers and no tomatoes. Nitrogen conservation in your compost is thus pretty important. But again, I had a hard time finding math equations for this -- unless you count all the cool papers that solved twelve nonlinear systems simultaneously.

Finally, after days of trolling through the library files and becoming much more aware of what a HUGE BUSINESS waste processing is, I found a paper with some polynomials. It's also got some great 3D graphs and some visualizations, in Figure 4, of how these functions depend on their independent variables. Might be food for another post. The authors of "Optimizing composting parameters for nitrogen conservation in composting" took an approach similar to the beet-research people: they did a bunch of experiments, measuring values for aeration of the compost heap, moisture content, particle size, and time after start, and ran a big backward computation to come up with polynomials in those variables (A, M, P, and t) that predicted the carbon/nitrogen ratio (among other things) pretty well. That is the polynomial that the worksheet below focuses on.

This worksheet covers

  • related rates, applying the product and chain rules a few times
  • physical reasoning: I ask students to examine the assumptions of the model, which I then violate for mathematical purposes!
  • and writing English sentences explaining a math result.

Teaching tips: students often freak out about all the symbols in here. Reassure them that many are constants in the problems they're asked to work out. Remind them that the derivative of a constant is zero, even if the constant is one they don't know!

I would like to have had some other "real-life scenarios" or more interpretation, so I'll think about what sorts of related-rates problems could be added to this.

Related Rates: Nitrogen

If you've got refinements or modifications, let me know!

Give me some optimal sugar... calculus-style

I was on a math trip this week, so have been a bit delayed in posting. After four days of intensive pure math thought, I've returned to my little farm in the city, the minuscule plot that is my back yard. Today was spent doing math and picking cherries. The beans and peas are doing well, too; we've got peas planted where we used to grow tomatoes in an effort to increase the nitrogen content of the soil without applying fertilizer.

I have the luxury of not depending on my little garden for my primary food source. Instead, I buy food from farmers either at the farmer's market or at the grocery store. It is nice to live in the city and be able to take the bus to the opera, but it means I depend on others for agriculture. They use fertilizer and irrigate their land because farmers must do everything they can to control growing conditions for their crops.

Today is about sugar beet production. (I also looked into optimization of conditions for composting, but there are no equations I can find!) Sugar beets are a major crop across the US, particularly in North Dakota, Minnesota, and Idaho. We love sugar and want it in many foods (until we find it's killing us) and of course farmers want to optimize their yields. Sugar beets are interesting because simply adding more nutrients to the soil can be counterproductive: you don't want the biggest sugar beets, you want the sweetest ones! Too little nitrogen means yellow leaves and poor growth. Too much nitrogen means impurities in your beets and reduced sucrose, or at worst killing your seedlings (source). It's the Goldilocks question.

An older report on how nitrogen levels affect recoverable sugar yields has some very nice equations. G.L. Malzer and Greg Buzicky looked at many variables and came up with several equations that predicted recoverable sugar yield pretty well, all in terms of the soil's nitrate-nitrogen content. And they're quadratic! This is a nice way to do a pretty easy optimization exercise with applications to something... sweet!

The first page is all about finding the optimum recoverable sugar yields given different levels of nitrate-nitrogen in the soil. The second page mixes in some experimentation and treats a two-variable function, foreshadowing multivariable calculus techniques. Including discussion of multivariable functions in a first-semester calculus course is a really cool idea that deserves more attention -- it does not disturb students, but only people who have a set idea of what one "should" learn in first-semester calculus. The third page asks students to use the first and second derivative tests to prove the results they've already produced, and asks them to think about the applicability of the Extreme Value Theorem. As in many situation, physical constraints could lead to a closed-interval phrasing of the problem, although it's not necessary mathematically. Provoke an argument!

Optimization: Sugar Beets

Agriculture is often ignored in calculus and STEM classes, as it's not so sexy these days. Universities like the University of Minnesota and Cornell have big ag programs, though, and they're hugely important. You sure can't be a vegan or vegetarian in the north without the products of modern agriculture!

I've learned a lot from my ag students and they need to deal with optimization often: they need to optimize nutrient composition in animal feed, optimize nutrient composition of fertilizers for soybean growth, optimize temperature for dry-matter intake of chickens, and of course look at the economics of all the above. Their decisions impact the diets, waterways, air quality, climate, and fuel prices of city-dwellers. Don't forget the ag, even if you live in LA.

Drugs in waterways: derivative mix

We return to naproxen (sold under the brand name Aleve). Naproxen is my "drug of choice" for these worksheets because it apparently occurs in a lot of our waterways and its decay is pretty well understood. Last time we discussed naproxen in particular, we looked at a function that gives the rate of photolysis for naproxen at a depth , the rate at which the substance breaks down in the presence of sunlight. There are a few different ways that substances like naproxen, ciprofloxacin (an antibiotic), cocaine, or bisphenol-A get taken out of waterways: breakdown in sunlight, breakdown by organic processes, or sedimentation. Naproxen breaks down easily in sunlight but it doesn't like to be filtered by sand or settle out into sediment even when the water is treated with ferric sulfate to make coagulation happen.

The linked abstract is for a paper about a pilot-scale drinking water purification plant, looking at how water from the River Vantaa could be used for drinking water if the groundwater source for Helsinki, Finland, were to be rendered unusable. Remember that groundwater usage is increasing enormously across the world, and so our nice clean aquifers are overtaxed in many locations. We should not waste so much water (agriculture and lawns, folks!) but will also need to learn a lot about how surface water can be purified so that we can drink it again.

The worksheet below has a mix of derivative and rate of change questions. It asks about some derivatives that require the chain rule (quotient rule and exponential function rule combined) and it also asks students, at the end, to switch variables and look at how the rate of photolysis changes as turbidity changes. After every heavy rain a lot of sediment enters a river and then settles out over time. Development and construction can also change turbidity substantially: digging up a lot of trees and plants to expose dirt allows a lot of that dirt to run off. Agriculture also has its role, as during the planting season fields can be vulnerable to erosion and run-off.

Chain Rule: Photolysis of Naproxen

If you're in a position to work with a science teacher or run experiments yourself, I found a fun page on experiments with turbidity appropriate to junior to senior high school students (and what college student wouldn't mind playing with mud, really?). This could make a cool big brother/big sister activity: high school seniors do the math and the freshmen or junior high students do some experiments on turbidity. In addition, there's a World Water Monitoring project and day (September 18) that you could join.

Lynx: the chain rule and a better model

As promised, a return to lynx. In my previous post about lynx I posted a worksheet modeling lynx populations with a cosine function, and mentioned that this is not the best model. Look at the derivative to see how bad it is -- the green and red lines ought to be matching up:

LynxModel1

Graphing the log of the lynx data gives a transformed graph that is much more sinusoidal! The better model for the lynx data, then, is exp(something sinusoidal). Look at the graph below to compare Model 2 and its derivative to the data. The green and yellow curves are much more alike:

LynxModel2

This worksheet guides students to developing this model after having them evaluate the previous sinusoidal model via technology.

The worksheet I'll include below is meant for a day when you have computer lab time with students. I know that this does not include everyone... but if you can head down to the lab for such an activity, there is a lot students can learn!

This worksheet applies knowledge of:

  • the chain rule, on compositions of trigonometric and exponential functions
  • numerical approximation of the derivative
  • shapes of graphs.

Along the way students must evaluate models and create one of their own.

As the instructor, you'll have to decide what software you want to use for this activity. I have had success using Excel, asking every student to email me their work on the way out of the lab, and these days you can use Google Drive if your institution uses Gmail. If you and your students are already quite familiar with R you could also use that. Beware of differences between Mac Excel and Windows Excel, especially in graphing -- work through the activity yourself on whatever platform students will use.

Chain Rule: Lynx

Lynx Pelt Data Spreadsheet

Stories and Graphing

I've been spending the last few days trying to edit some math papers I'm working on and learn more about polygon spaces. (What's the space of quadrilaterals in with side lengths (1,2,1.3,1.8) and one vertex at the origin, for instance? If you guessed that it looks like , you'd be right!)  It's always interesting to talk with students about what mathematicians do. They expect we do more with numbers, and when I talk about what I am working on they're surprised at all the funny little pictures I draw and all the writing we all do.

This activity is a good one for discussion. You could either print this or use a projector to put it up in front of the class for a group discussion. Group discussions can be a great way to get a class comfortable with each other and facilitate the verbal discussion of mathematics, which is another skill that must be learned and practiced. I had a hard time learning to "talk math" despite my good reading and essay-writing skills, and even now I need to gather my thoughts to produce coherent mathematical sentences in a way that I don't need to when talking about politics, for instance. I've concluded that I think about mathematics nonverbally and that the translation process simply takes some time, even now that I've had a lot more practice than your average freshman.

When I run a class discussion like this, I try to do a few things:

  • Give students a minute or two to think in silence and write down a tentative answer.
  • Start cold-calling students -- "Pahoua, what do you think about the first one? Jordan, what about you?" This requires a level of trust that is built over time.
  • If students are right, I don't necessarily say so and move on -- I keep asking other students, and ask other students if they think the first student is right or not. I don't want students practicing the Clever Hans strategy. (Clever Hans is a horse who counted by tapping his hoof, but he just watched his trainer until the trainer looked happy and then stopped.)
  • If students are wrong and I can identify the assumption that led to the mistake, pointing out that assumption can often help. "Danielle, are you assuming that the graph must be increasing?" Sometimes I ask other students for their thoughts. "It looks like Jason disagrees. Why?"
  • If a student is visibly hesitant or reluctant to answer, ask for a question or the beginning of the thought instead. "Alexi, what do you think about part c? ...   What strategy are you thinking of trying?" or "What do you notice first about the graph?" or "What question are you asking yourself right now?" These often prompt good discussions.
  • I do try to use students names consistently as I call on them, and
  • I try to keep track of who I call on and rotate through the whole class. There's plenty of research that shows that even the most enlightened and conscious instructors call more on boys than girls, etc., so bringing a class list and discreetly checking names off is an easy way of making sure you involve everyone in discussions. Telling students that you track who you ask is sometimes useful, too, because then they know that everyone will be asked and they should be prepared! Students do think that it's fair to do this, especially if you offer the outs suggested above if they are stuck.

So, with no further ado, here is a worksheet on matching graphs and stories, using the language of derivatives:

Graphing Stories and Stories of Graphs

Copyright details: The graphs on page one are:

(A) Water levels in Lake Superior measured at Marquette, MI, using data from http://www.glerl.noaa.gov/data/now/wlevels/levels.html as suggested by commenter TAO. 

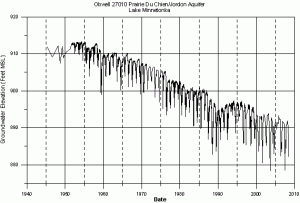
(B) Well water depth data from observation well 27010, with data from http://www.dnr.state.mn.us/waters/groundwater_section/obwell/waterleveldata.html

(C) Data on lynx populations using the dataset included in the R programming package. The data is from the Hudson Bay company's logs.

(D) A graph from http://www.arctic.noaa.gov/reportcard/lemmings.html, since I can't seem to find raw data for lemmings. Used under the fair use policy for copyrighted documents and documents produced by the federal government. 

Rates of rates of change

Some instructors (like me!) like to foreshadow the ideas of concavity early in the semester. When I talk about rate of change, average and instantaneous, I like to throw out some discussion of the rate of change of the rate of change. This is a language puzzle for many students -- they may see that a function is increasing but need to think harder about whether it is increasingly increasing or decreasingly increasing. What does that all mean, anyway?! It's a great time to discuss precise mathematical language, communication skills, and the usefulness of equations. It is easy to be precise when symbolically indicating that a function is concave up, but our English language can obscure meaning here. Politicians certainly take advantage of this when discussing the decreased rate of growth in the budget or slowing the rate of budget cuts for social programs!

(Any examples a reader would like to publicize here? I know I've heard some great political lines like this but I cannot find a citation...)

This worksheet goes back to the air pressure activity introduced earlier. It is a fairly straightforward exercise in

  • computing average rates of change,
  • plotting secant lines, and
  • taking a first pass at the concept of concavity. 

Because it's straightforwardly computational rather than deeply conceptual, use this for a moment in class when you want students to work through the ideas but also want to give them a little mental break. It's a good time for getting a drink of water or chatting a bit about how things are going. Sometimes students need some computation and a stretch, as the ability to concentrate on mathematics for more than twenty minutes at a time takes development through repeated practice.

Rates Of Change: Mountains

I've been working on a post about interpretation of story problems and graphs, so that will probably make an appearance next week. It's also time to go toward derivative rules and derivative graphing. Good old-fashioned non-applied explanations of the derivative at a point and the derivative as a function are up to you, as I find students need a purely mathematical or formal explanation before applications. We'll revisit lynx and naproxen and hopefully add another story to the mix!

Aquifers and Rate of Change

Since childhood I'd had a mental image of an aquifer as a big underground lake, but it turns out that's not so accurate. Aquifers are layers of permeable rock or ground-up rock (dirt, silt, etc.) below the earth's surface that contain groundwater. When we sink a well down to water, we're trying to extract water from an aquifer. Any time you hear about groundwater usage (as opposed to surface water usage) you should think "aquifers!"

Why care about aquifers? Well, I like to drink water. When I visited Charleston, South Carolina and Savannah, Georgia this spring I learned that many wells in the region have been rendered useless because of saltwater intrusion -- if you pump out fresh water and you're near the coast, salty water comes in! Also, I would like it if my house did not collapse into a sinkhole. Apparently in 2010 about 130 sinkholes appeared in Florida, because of rapid removal of water from aquifers. That water in the spaces in the rock is pretty important. Last of all, many people enjoy lakefront property and recreation. The site just linked is for the White Bear Lake Restoration Association. Why does White Bear Lake in Minnesota need a restoration association? Because it's been shrinking dramatically, and now the docks are on dry land and lakefront property isn't on the lakefront any more. The US Geological Survey (USGS) and Minnesota DNR have concluded it's because of the draining of an aquifer that has contact with the lake.

Alright. We like drinking water, not falling into sinkholes, and waterskiing rather than trudging through muck. How, then, do scientists look at aquifer health? One way to do this is through keeping track of well levels across a region and coupling that data with geological information about aquifer locations. The graph of water level for a well is called a hydrograph, and this one is shared directly from the Minnesota DNR page with their permission:

fig1ppt

The USGS maintains a groundwater watch page from which you can find all sorts of data for your local wells, and many states maintain similar pages. I used the Minnesota Water Level Monitoring Page to find the raw data for the above well, and then used the R program to create graphs for this worksheet on rate of change.

You'll notice a huge seasonal variation in well depth. Groundwater is commonly used for industrial applications, which may be year-round, but also for agriculture and lawn care, which are seasonal. According to one source, the city of Woodbury in Minnesota pumps around 5 million gallons a day in winter and 20 million gallons a day in summer.

This worksheet looks at real, messy data. Students are asked to estimate a lot of numbers and discuss their estimates with group members and the instructor. It's a good time for discussion of estimates and how we deal with real, messy data -- shill for your local statistics class here! The worksheet covers:

  • graphical approximation of average rate of change,
  • graphical approximation of instantaneous rate of change,
  • creating a linear model using approximations of rate of change,
  • and analyzing the model.

The graphs take up a lot of room but the questions are pretty straightforward, so print it double sided and it won't take that long to do in class. Have students work in groups and ask different groups to report their results by writing them on the board: they will have different numbers and can discuss the validity of each approximation. The last question, in particular, is open for a lot of debate: what does it mean for a well to "run dry" if there is seasonal variation in water level?

 Rate Of Change: Aquifers worksheet

Oh, if you've forgotten, remember we're still under federal budget sequestration: the USGS is going to have to turn off a number of streamgages used to monitor stream health and warn of flood events because it can't afford to keep them going...

Incorporating short projects

So far I've provided worksheets for group work in class, as many instructors are not able to modify the curriculum or grading system for the first-year calculus courses they teach. Worksheets work well in this situation because you can just slip them into a class discussion when you've covered the basic lessons, or give them out to students who are more advanced. On the other hand, even in somewhat inflexible courses sometimes you have the freedom to give students a take-home mini-project. Many of the topics I've covered so far could be the seed for a mini-project.

When I say mini-project, I'm talking about a project (somewhat open-ended) that is less than two pages. Less than two pages ensures mini-ness and makes it easier to grade.

An example of a mini-project would be:

  • Find your own population to model (subject to instructor approval) or use the lynx population in the Yukon between 1821 and 1934. State clearly in words what population you are modeling, what type of equation (trigonometric, exponential, linear) you are using, and why.
  • Write an equation that models the population using appropriate mathematical symbols.
  • Create a graph with the data and your model clearly indicated.
  •  Discuss the strengths and weaknesses of your model.

One possible rubric, then, grades students on writing, modeling, and graphically presenting data:

Sample grading rubric for mini-projects

In other classes I've used a rubric that grades on clarity, conciseness, correctness, and completeness, especially useful for writing-intensive exercises. Peer grading is another option for situations in which instructor grading will not work, and has the benefit of exposing students first-hand to the difficulty of reading the mathematical work of others!

(A gratuitous sample peer-review rubric from another class -- not calc!)

I find that a very concrete rubric for mini-projects helps students structure their exploration: they know they need a topic that they can (1) model with an equation and (2) draw a graph for. These mini-projects are to reward exploration, which is something many students taking calculus as a terminal class really fear!

I love mini-projects. They're a good way to allow some creativity in a rigid structure -- replace a quiz! They are low-stakes: when students send you the panicked email about how long it needs to be, you say, "Less than two pages -- with pictures." Often students can come up with really cool topics from other classes or other life experiences, so with a solid rubric they're actually fun to read and not so hard to grade.

Drugs in our waterways: the worksheet

As promised, here comes the worksheet for drugs in waterways. As I mentioned yesterday, this was the worksheet hardest to construct so far.

I did a lot of reading on pharmaceuticals in waterways and I liked the paper "Attenuation of Wastewater-Derived Contaminants in an Effluent-Dominated River," from 2006. It discusses the importance of biodegradation and photolysis in breaking down naproxen (brand name Aleve) in the Trinity River, which is full of water from a wastewater treatment plant much of the time. It's got some great graphs and a good set of supplementary calculations and information, which allowed me to pick out the pre-calculus problem inherent in the analysis.

The worksheet is set up as three pages that might be usable somewhat independently: the first page sets up the problem and asks about domain and range, the second asks about limits, and the third asks about piecewise functions. When used in a classroom, you're going to want to know that students will need calculators and could perhaps profitably use graphing software. (A little hand-graphing is good for them, though, as it's so useful later on.)

So:

  • limits,
  • continuity, and
  • piecewise functions.

Worksheet on Photolysis of Naproxen

First page: challenge them to think symbolically about domain and range, and physically. Negative depth in the river doesn't make sense. They don't need to know the values of alpha or k_{surf}, though they'd prefer to!

Second page: I've deliberately given a limit (as z goes to zero) that will not be easy using limit rules (unless there's a trick I haven't seen). It is very easy using L'Hopital's rule or a power series expansion of the exponential so tell students they will soon have tools to do this rigorously. For now, they can use numerical calculation and grapple with the idea of "limit." Students also already have the value at zero, given implicitly in problem 3 by the scientists. We have a removable discontinuity at z=0, always a somewhat challenging concept for students. The limit as z goes to infinity can be done with limit rules.

Third page: Piecewise functions! Some students like 'em, others hate 'em, and many mostly understand but don't know how to write 'em. Coach students through correct 'mathematical grammar' for piecewise functions. There's also a chance to practice writing nice coherent sentences explaining why a function is continuous at the end of the page. At every university or college I've taught at, students have wanted more examples of how to write mathematics -- this is a good chance!

Along the path to this worksheet, I learned why water is blue!

Ok. Off to enjoy some sunlight now. I'm going to wear my mineral sunscreen so that I don't have to worry about avobenzone sloughing off of me into my local waterways... Once limits and continuity are covered, we're only a few steps away from the definition of derivative.

Drugs in our waterways: teaser

This is definitely one of the more complex topics we'll be discussing on the blog. Physics can be so clean -- bodies of rock moving through space, atmospheric gas escaping -- but biology, especially when we start talking about ecosystems, can be so messy! I mean literally as well as figuratively: people who work on measuring the levels of pharmaceuticals in our waterways have to wade through muck, dig through algae, and get in boats!

The presence of pharmaceuticals and endocrine-disrupting compounds in our waterways is an issue that's only becoming more pressing. I'll concentrate on Minnesota because that's where I live. Remember that flap about water bottles containing bisphenol-A? Maybe you switched your water bottle -- but you can't get away from the fact that small quantities can now be found in over 40 percent of Minnesota lakes [1]. Don't take antidepressants at the moment? Well, maybe you'll get a little when you're swimming: venlafaxine (sold as Effexor) is found in 9.4 percent of stream water samples analyzed by the Minnesota Pollution Control Agency in 2010 [2] and amitriptyline is found in almost 30 percent of lakes randomly sampled in 2012 [1]. Disturbingly, cocaine is found in over 30 percent of lakes, too -- what are Minnesotans doing?! [1] And you'd think we'd have fewer mosquitos here given that DEET, the insect repellent, is found in over 70 percent of our lakes! [1]

While the amounts we're talking about are very tiny, they still disrupt fish and mussel life and reproduction. Strangely, fish exposed to some antidepressants are more aggressive predators. Frogs exposed to birth control chemicals can reverse sex. We don't really know what happens to humans exposed to frequent low-level chemical concentrations of this type, although there are disturbing preliminary results relating endocrine disruptors to obesity, diabetes, and endometriosis. We do know that the pharmaceutical industry is hugely important economically, and there is conversation around making the industry greener.

Ok: enough geeking out about the prevalence and importance of drugs in our waterways. Where's the math?

I'm working out a worksheet that will discuss photolysis, the breakdown of chemicals due to light exposure. The rate of photolysis depends on the clearness of the water at a given depth in the photic zone (the zone that light can reach), and this rate constant can be modeled by a

  • composition of a rational function and an exponential function.
  • This function gives a rate, even though we haven't done any differentiation.
  • I'm hoping to work in a page on limits as well.

However, this post is super-long already -- so I'll  stop! The worksheet should be up today or tomorrow (Tuesday).

[1] Pharmaceuticals and Endocrine Active Chemicals in Minnesota Lakes, released May 2013, online at MPCA site on water. Dramatic graph on page 6.

[2] Pharmaceuticals and Personal Care Products in Minnesota’s Rivers and Streams: 2010, released April 2013, online at MPCA site on water. Pages 2-3 discuss venlafaxine.